CT Cloud Contact Center - Monitoring Page
Overview
Navigating to and using the Monitoring Page in CT Cloud Contact Center (Telax).
Resolution/Steps
First you will need to navigate to Monitoring, you can get to this from your favorites page, if you do not see it on your favorites page you can add it by following this article CT Cloud Contact Center: Telax - Adding Favorites
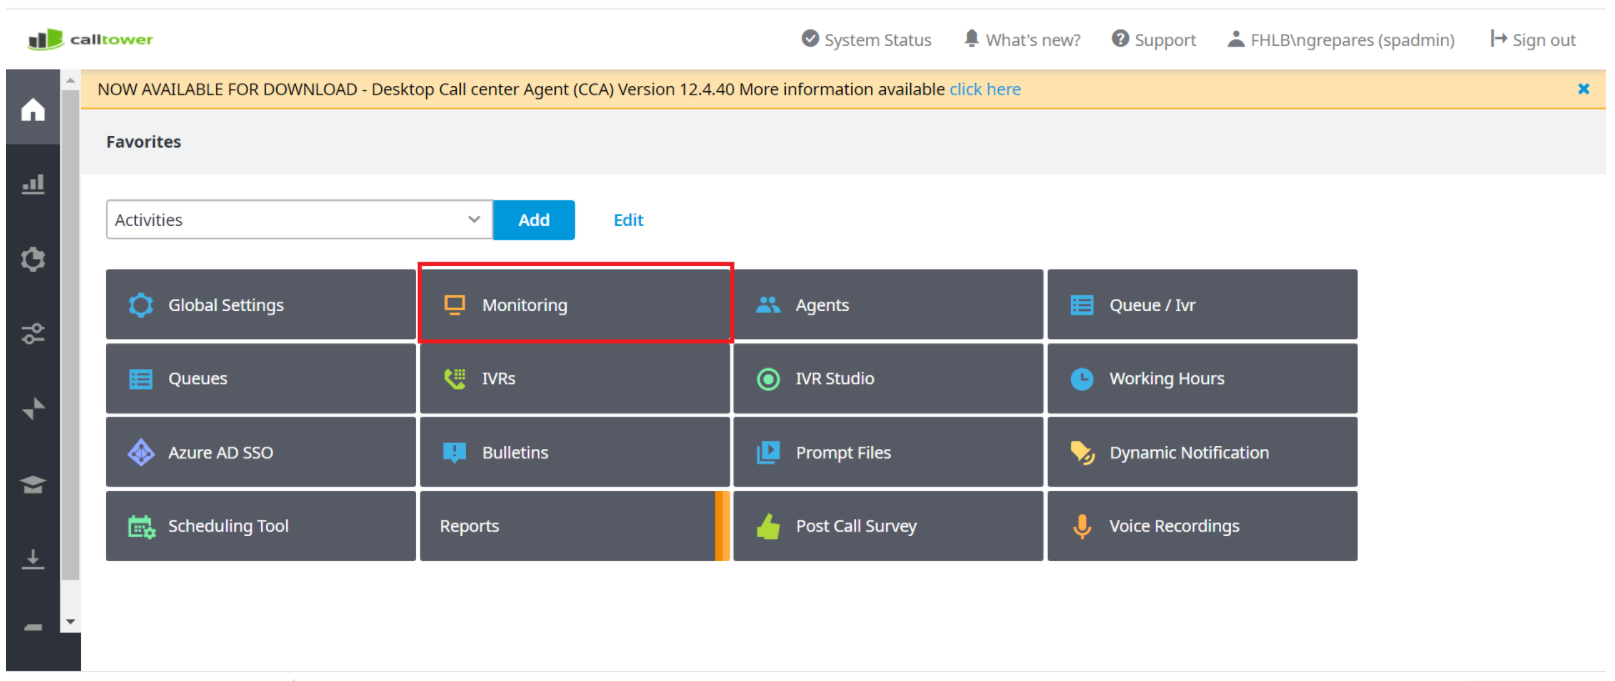
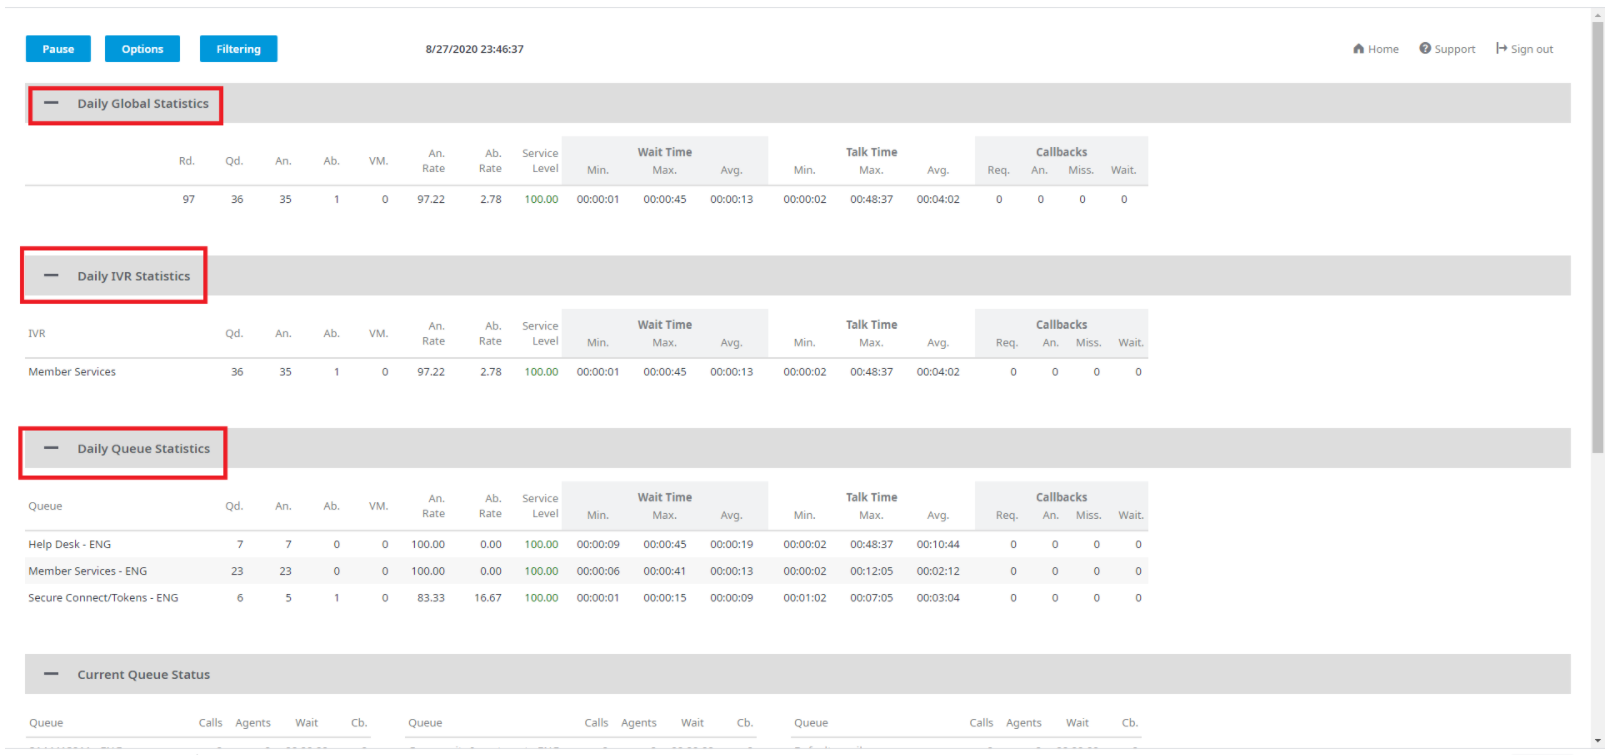
This will take you to a new page, the page is shown below.
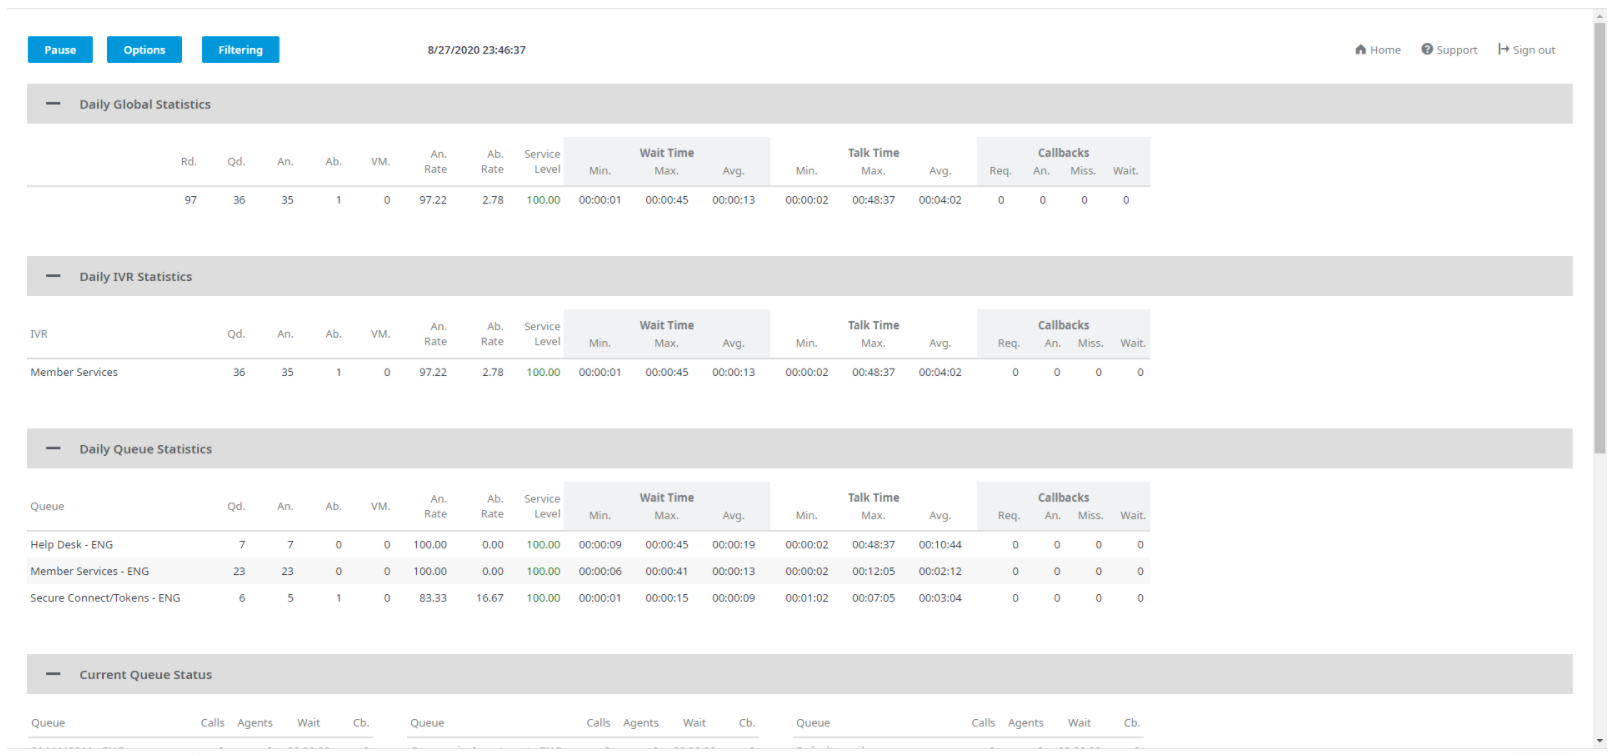
You can use the monitoring page to check queue statistics as well as Service Levels.
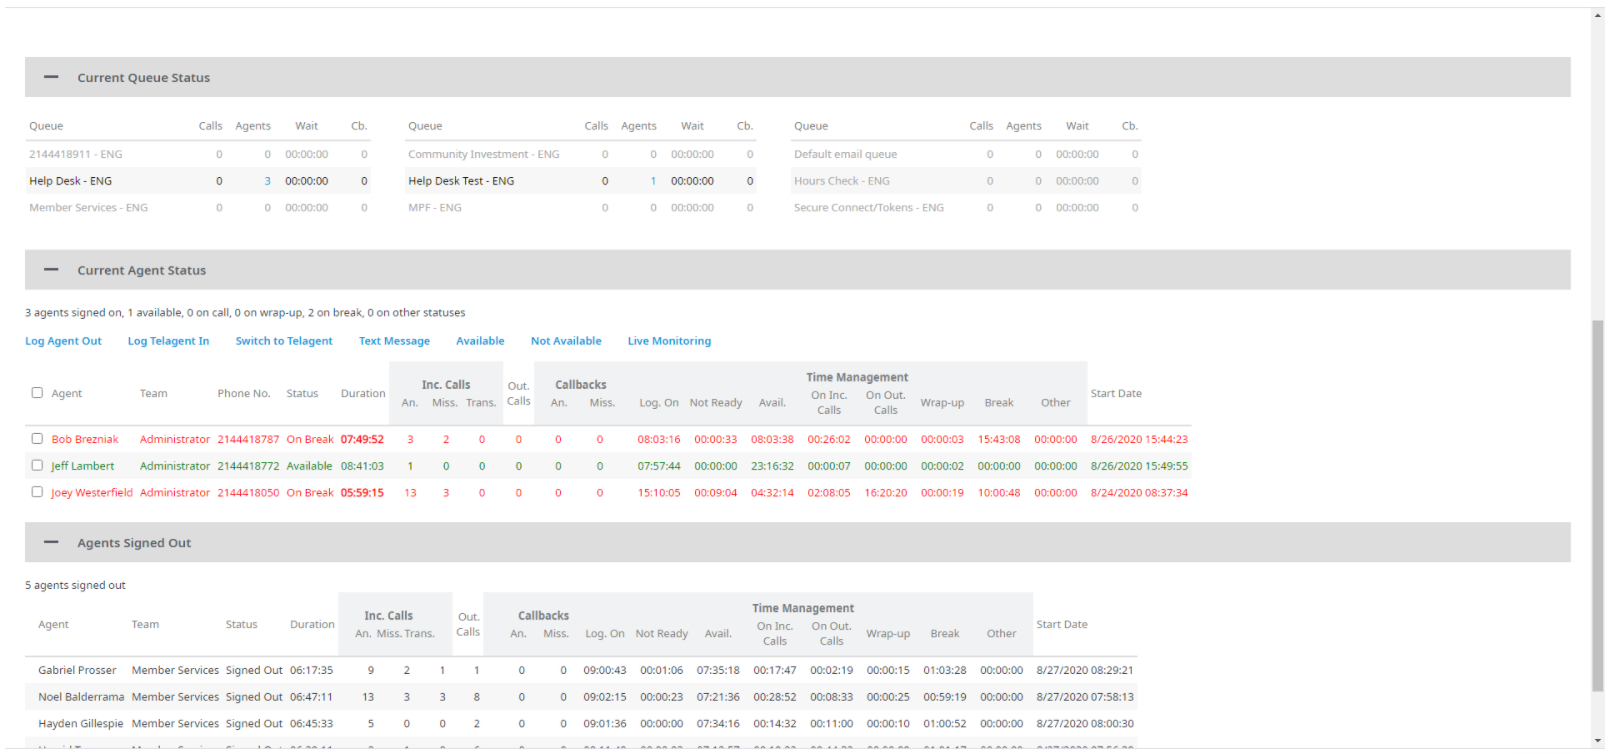
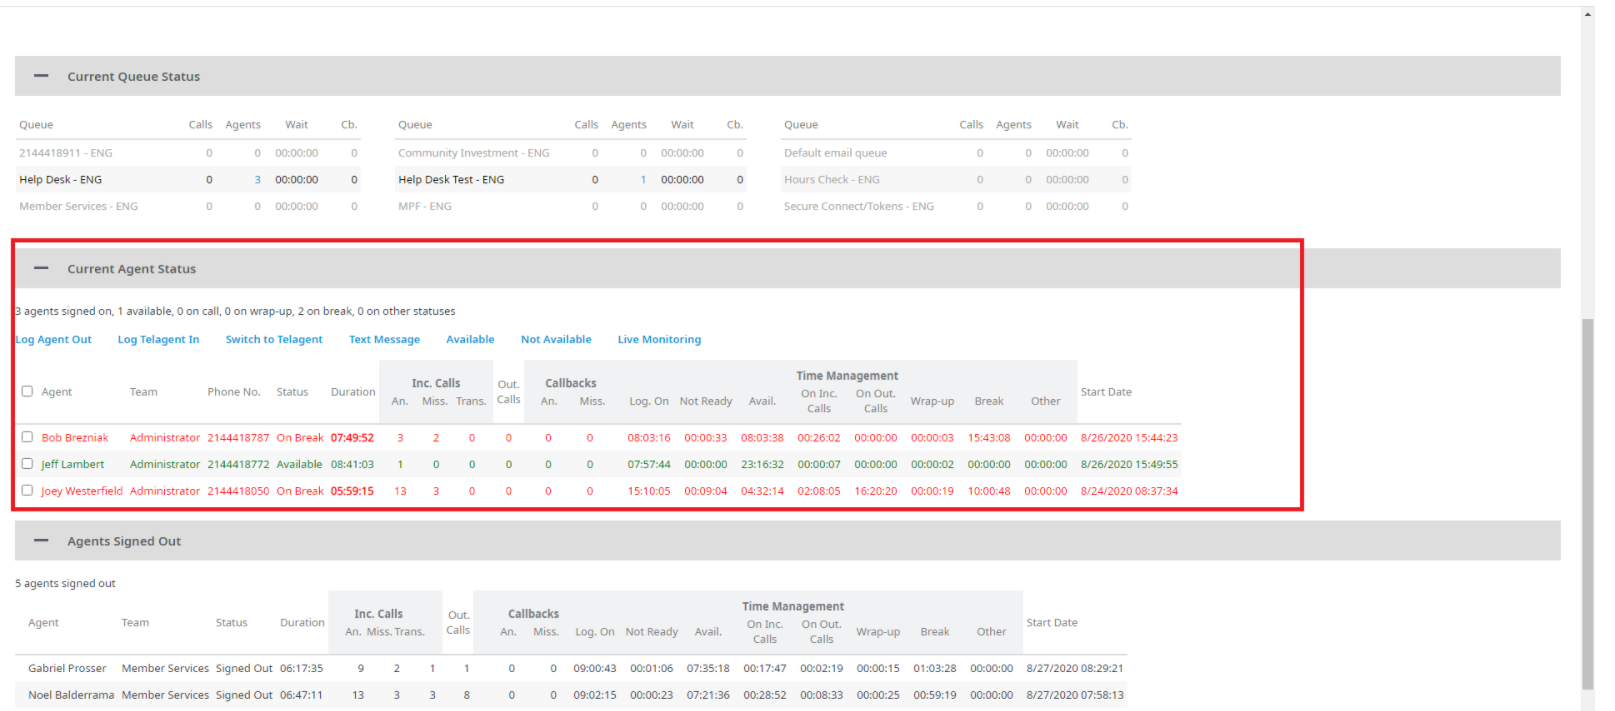
You can use it to also Check Agent Status
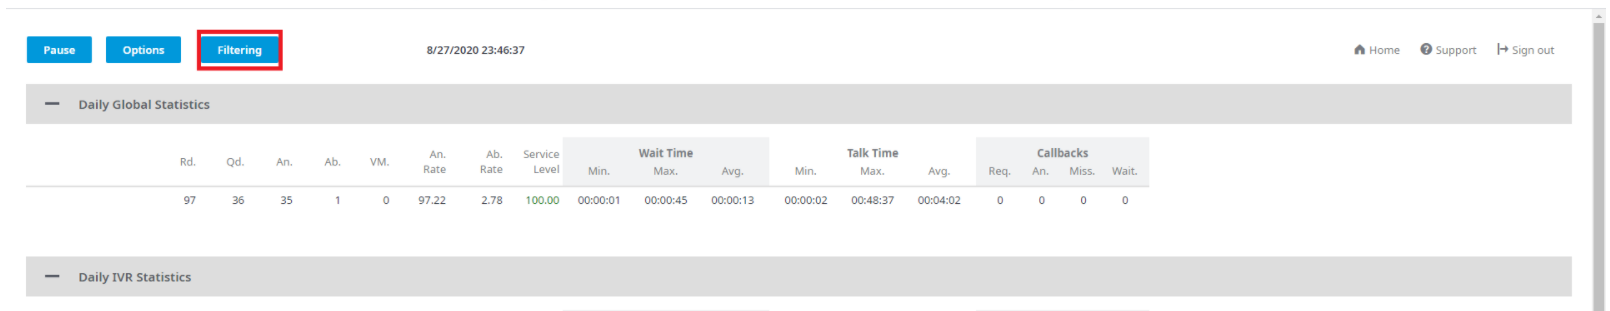
If you only want to view a specific Queue you can apply Filters shown in the image below.
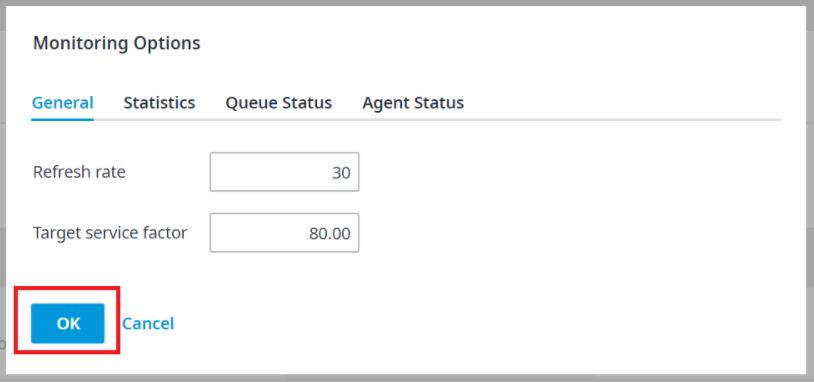
You can also edit the refresh rate of the monitor, to be faster or slower depending on your preference. Select Options and then edit the refresh rate as shown below
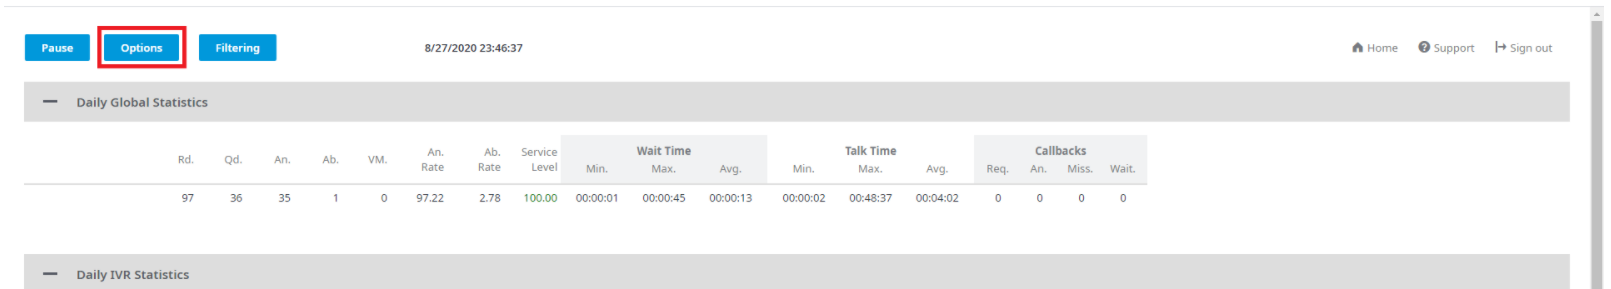
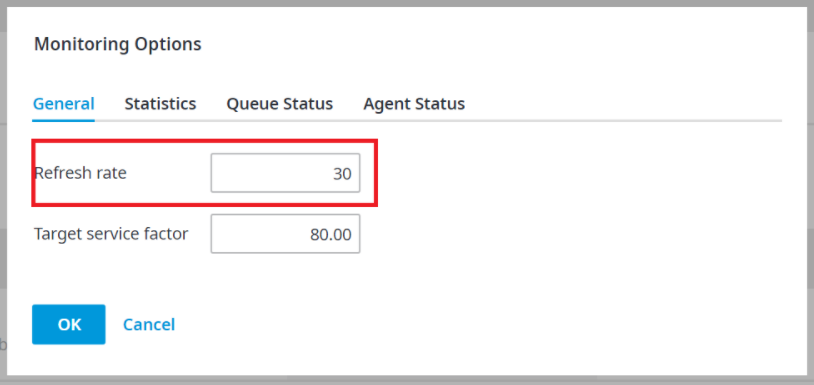
Click OK to save changes.