CT Cloud Contact Center - Supervisor Guide
Note: The Supervisor Dashboard is not available for standard Multi Line Hunt Groups (MLHGs.) It is available with Basic Contact Center. The Supervisor Dashboard is enabled for accessed by clicking on the Supervisor Dashboard button on the MLHGs tab of the Business Group Administrator interface. A user must be a BG Admin in order to access the Supervisor Dashboard.
Summary
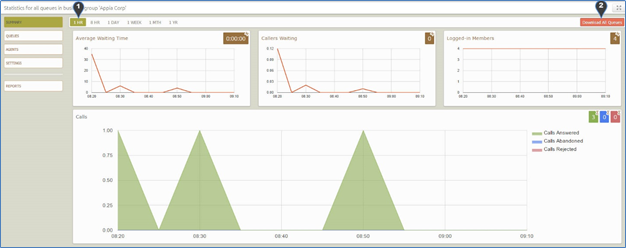
The Summary tab provides statistics for ACD activity throughout the entire Business Group. The summary time period can be changed by clicking on the timeframe you want to view as indicated by the number one below. Options include the past hour, past eight hours, etc. You can download a CSV file containing this data by clicking on the Download All Queues button as indicated by the number two below.
Queues
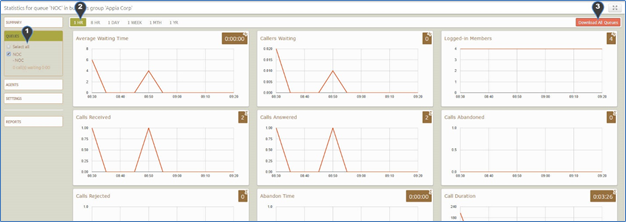
The Queues tab shows specific information from one or more queues, such as calls received, abandoned calls, etc. Select the queue(s) you want to view by clicking on the checkbox for each queue to select / unselect as shown below by the number one. The displayed time period can be changed by clicking on the timeframe you want to view as indicated by the number two below. Options include the past hour, past eight hours, etc. You can download a CSV file containing this data by clicking on the Download All Queues button as indicated by the number three below.
Agents
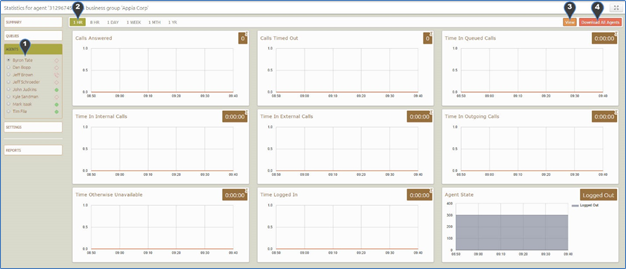
The Agents tab allows you to see agent specific information, such as number of calls answered, time in queued calls, etc. Select an agent to view using the radio buttons on the left side of the screen, indicated by the number one below. To the right of each agent is an icon that indicates his current state. If you mouse over the icon, the name of the current agent state will appear. The displayed time period can be changed by clicking on the timeframe you want to view as indicated by the number two below. Options include the past hour, past eight hours, etc. Click the View button as indicated by the number three below to view the agent dashboard for that agent. The agent view will pop up in a new window, and can be used to change the agent’s current state. If the agent you are viewing in the Supervisor Dashboard is on a call and the features are enabled, you will see buttons for Monitor Whisper, and Barge-In to the left of the View button. Click on the corresponding button to use that feature. Your phone will ring, and when you answer, you will be able to monitor, whisper, etc. You can download a CSV file containing this data by clicking on the Download All Queues button as indicated by the number four below.
Settings
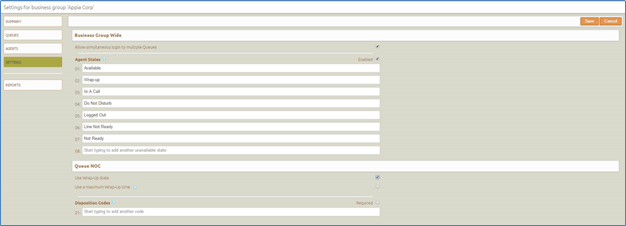
The Settings tab allows configuration of several items:
- Allow Simultaneous Login to Multiple Queues – This option allows agents to log in and out of multiple queues separately, provided each queue allows the agent to log in / out.
- Agent States – Check the Enabled box to enable agents to specify state in addition to logging in and out. There are seven preconfigured states, only Not Ready can be modified. Add additional states by entering the state name in the box that says “Start typing to add another unavailable state.” This can be used to add states like “Training” or “In a Meeting.” Delete the text from an agent state to remove it. Click the Save button to apply changes. NOTE: Avoid changing position of the states if you want to preserve the meaning of historical data. Statistics are stored tracked by number, so changes to the order will mean the wrong historical data will be associated with the new state. Agent states are configured for the entire Business Group – they cannot be configured differently on individual queues.
- Wrap Up State – When enabled, this option puts the agent in the state “Wrap Up” after he hangs up on an ACD call. The agent is unavailable for calls while in Wrap Up. If a maximum wrap up time is specified, the agent will automatically return to the Available state at the end of the specified time. Maximum wrap up time is specified in seconds. The agent can manually return to the Available state at any time. Wrap Up State is configured per queue.
- Disposition Codes – If Wrap Up is enabled, Disposition Codes can be used to force the agent to choose a reason or resolution for the call. Check the Disposition Codes – Required checkbox to enable disposition codes, then add codes below. Delete the text from a Disposition Code to remove it. Click the Save button to apply changes. NOTE: Avoid changing position of the codes if you want to preserve the meaning of historical data. Statistics are stored tracked by number, so changes to the order will mean the wrong historical data will be associated with the new code. Disposition Codes are configured per queue.
Reports
The Reports tab allows you to configure ad hoc and scheduled ACD reports. Click on the Add a New Report to begin. You can display reports on a web page or have them emailed as PDF files.
Running a Report
- Select the Report Type from the drop down menu. A list of reports is available in a separate document.
- If the Report Type allows you to specify which queue or agent to include, choose in the Select Data dropdown menu.
- Configure the start and stop date of the report in the Period boxes. Configure the start and end of day times if you do not want reporting for the entire 24 hour day.
- If you want to limit the days included in the reporting period, click on the days of the week that should be included in the report. Selected days will appear in a darker color that unselected days. This option can be used to restrict reporting to weekdays, for example.
- Click on the Update Report button to run the report. The report information will appear on the screen.
Scheduling a Report
- Perform steps one through four of Running a Report as shown above.
- Enter a Report Title. This can be anything, but should be meaningful to you.
- Select a schedule from the drop down menu. To run a report once, choose the One Off option. This will email the report within about 15 minutes if the chosen time period has already elapsed. If you schedule a One Off report with a reporting time that ends in the future, the report will be emailed after the end of the reporting period. If scheduling a weekly report, choose which day of the week to use. If scheduling a monthly report, choose which day of the month to use.
- Configure the email recipients that will receive the report. Multiple email addresses can be used, separated by commas.
- Click the Save button to save the scheduled report.
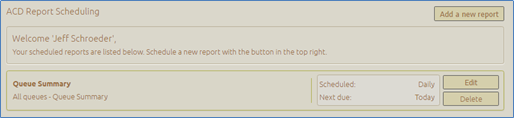
Managing Scheduled Reports
You can edit or delete a scheduled report by using the buttons to the right of each report. Use the Add a New Report button to create new scheduled reports or run a report in the web interface.
ACD Report Types
You can create the following types of report using the Reports page.:
Agent Summary
The Agent Summary report gives an overview of the performance of all of the Agents in your call center, allowing you to spot any issues that may require further investigation. It includes general performance information for all Agents in the Business Group or Departments that you manage (and any of their sub-departments) during your chosen time period. The entirety of this time period must be within the last 60 days. This information is presented in a table. Note that this table does not include information on incoming calls that were not received via a Queue or outgoing calls.
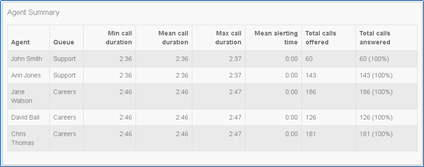
Each row in the table gives information on an Agent's activity when handling calls from a particular Queue, as indicated in the Agent and Queue columns. Note that an Agent who is a member of multiple Queues will have a row in the table for every Queue that they are a member of.
The following information is provided.
- Min call duration - The duration of the shortest call answered by the Agent that was received from this Queue during the specified time period.
- Mean call duration - The average length of a call answered by this Agent from this Queue during the time period specified.
- Max call duration - The duration of the longest call that this Agent handled from this Queue during the time period specified.
- Mean alerting time - The average amount of time between a call from this Queue being hunted to the Agent and the Agent answering their phone.
- Total calls offered - The number of calls offered to this Agent from this Queue during the chosen time period.
- Total calls answered - The number of calls answered by this Agent from this Queue.
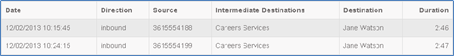
Call Log
The Call Log report gives a detailed overview of call activity for your call center, providing information on all calls made to or from the Business Group or Departments that you manage (and any of their sub-departments) during your chosen time period. The entirety of this time period must be within the last 60 days. This information is presented as a table with a row for each call.
The following information is provided for each call.
- Date - The date and time at which the call was initiated.
- Direction - Whether this was an incoming, outgoing or internal call.
- Source - The number of the calling party.
- Intermediate Destinations - Any numbers that this call was routed to before reaching its destination. This may include an MLHG Pilot Number or the names or numbers of any other Agents that this call was hunted to before it was answered or abandoned.
- Destination - The number of the party that received the call.
- Duration - The duration of the call.
Note that calls which have used any of the following services may be listed more than once, with each listing representing a leg of the call.
- Call Waiting
- Call Pickup
- Call Hold
- 3-Way Calling
- Some types of call transfer, for example if a call is transferred by a Business Group line into an MLHG, the initial leg of the call will be reported separately.
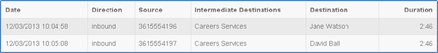
Call Detail by Agent
The Call Detail by Agent report offers a detailed view of call activity for a particular Agent, allowing you to easily assess their level of performance. It provides information on all incoming and outgoing calls involving an Agent during your chosen time period. The entirety of this time period must be within the last 60 days. This information is presented as a table with a row for each call.
The following information is provided for each call.
- Date - The date and time at which the call was initiated.
- Direction - Whether this was an incoming, outgoing or internal call.
- Source - The number of the calling party.
- Redirections - Any numbers that this call was routed to before reaching its destination. This may include an MLHG Pilot Number or the names or numbers of any other Agents that this call was hunted to before it was answered or abandoned.
- Destination - The number of the party that received the call.
- Duration - The duration of the call.
Note that calls which have used any of the following services may be listed more than once, with each listing representing a leg of the call.
- Call Waiting
- Call Pickup
- Call Hold
- 3-Way Calling
Call Duration Summary
This Call Duration Summary report gives a clear indication of how quickly your Agents are dealing with customer calls. It provides information on the length of calls answered by Agents for a particular Queue during your chosen time period. The entirety of this period must be within the last 60 days. Note that calls will only be included if they started in the specified time period. A call does not have to finish within the specified time period to be included. If a call is passed from one Queue to another, it will be included in the Call Duration Summary report for both Queues. For ease of use, calls are divided into a number of duration ranges, starting with calls less than one minute long and going up to calls over an hour long. This information is presented in both a histogram and a table.
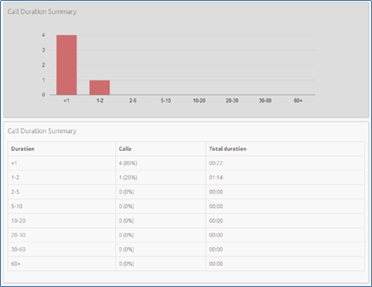
The histogram shows how many answered calls fell into each duration range during the specified time period. The table presents the same information, along with the total duration of all calls in each duration range.
Daily Traffic
The Daily Traffic report provides a useful indication of when your call center is at its busiest, allowing you to identify peak hours of activity and whether your Agents are handling more calls in the morning or afternoon. It provides information on the volume of incoming calls to the Business Group or Departments that you manage (and any of their sub-departments) during your chosen time period. This time period must be within the last 32 days. The information is presented in a bar chart and table.
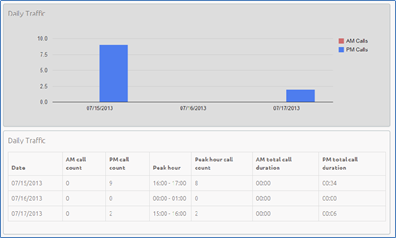
The bar chart displays the number of calls received each day from 0.00am to 12.00 and from 12.00 to 24.00. If the hours of a working day have been specified using the Start of day and End of day fields, calls started outside of the hours of a working day will be excluded from this count.
The table presents the following information for each day that is included in the specified time period.
- AM call count - the number of calls received from 0.00 to 12.00. If the hours of a working day have been specified using the Start of day and End of day fields, calls started outside of the hours of a working day will be excluded from this count.
- PM call count - the number of calls received from 12.00 to 24.00. If the hours of a working day have been specified using the Start of day and End of day fields, calls started outside of the hours of a working day will be excluded from this count.
- Peak hour - the hour of day during which the most calls were received. Note that the peak hour can only be calculated for data that is less than 32 days old.
- Peak hour call count - the number of calls received during the peak hour. Note that the peak hour call count can only be calculated for data that is less than 32 days old.
- AM total call duration - the total duration of all calls received from 0.00 to 12.00. If the hours of a working day have been specified using the Start of day and End of day fields, the duration of calls that were started outside of the hours of a working day will be excluded from this count.
- PM total call duration - the total duration of all calls received from 12.00 to 24.00. If the hours of a working day have been specified using the Start of day and End of day fields, the duration of calls that were started outside of the hours of a working day will be excluded from this count.
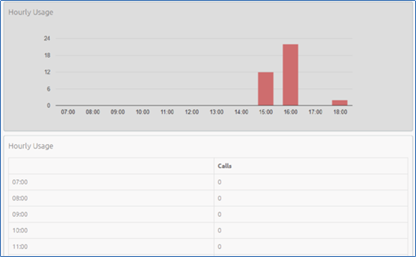
Hourly Usage
The Hourly Usage report allows you to see which hours of the day a Queue is at its busiest, helping you to plan when extra Agents may be required to answer calls. It provides information on the volume of calls handled per hour by a particular Queue during a specified time period. The entirety of this time period must be within the last 32 days. If the time period that you specify is longer than one day, the totals shown for each hour will be the number of calls made during this hour on all selected days. If you use the Start of day and End of day fields to specify the hours of a working day, any activity outside of these hours will be excluded from the report.
This information is presented in a histogram and table, which both display the number of calls per hour that were received through your chosen Queue and answered by an Agent.
User Statistics
The User Statistics report provides an overview of the performance of each of the Agents in your call center, allowing you to quickly view key metrics such as how many calls Agents are failing to answer and how long on average they are taking to deal with customer calls. It provides call statistics for each Agent in the Business Group or Departments that you manage (and any of their sub-departments) during your chosen time period. The entirety of this time period must be within the last 60 days. This information is presented in a table, with each Agent having one row for incoming call statistics and one row for outgoing call statistics, as indicated in the Direction column.
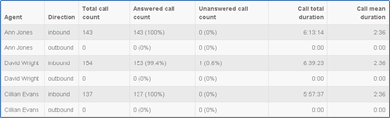
The table presents the following information on an Agent's incoming and outgoing calls during the specified time period.
- Total call count - The number of incoming/outgoing calls involving this Agent.
- Answered call count - The number of incoming/outgoing calls involving this Agent that were answered by the called party. This is also shown as a percentage of the total outgoing calls made.
- Unanswered call count - The number of incoming/outgoing calls involving this Agent that were not answered by the called party. This is also shown as a percentage of the total outgoing calls made.
- Call total duration - The total duration of all incoming/outgoing calls involving this Agent.
- Call mean duration - The average duration of an incoming/outgoing call involving this Agent.
Agent Status Summary
This report is only available for Agents that are members of a Premium ACD Queue. The Agent Status Summary report allows you to see how long an Agent has been spending in each Agent State during your chosen time period, which must be within the last year. For more information on Agent States and how to configure them, see Agent States. The information is presented in a pie chart and table.
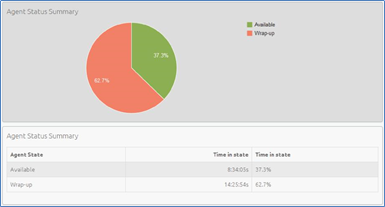
The pie chart displays the percentage of your chosen time period that the Agent spent in each Agent State.
The table displays the total time that the Agent has spent in each Agent State. This is also presented as a percentage of your chosen time period.
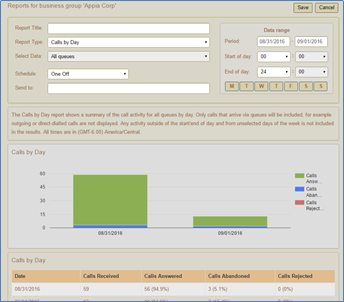
Calls by Day
The Calls by Day report allows you to see the number of calls per day that are being received by your call center and how they are being handled. You may want to use this report to identify patterns in call volume so that you can anticipate busy periods in future, or you may use the output to identify unexpected rates of call abandonment or rejection. The report provides statistics on call activity for the Business Group or Departments that you manage (and any of their sub-departments) on each day that falls within your chosen time period. The entirety of this time period must be within the last year. Note that if you use the Start of day and End of day fields to specify the hours of a working day, any activity outside of these hours will be excluded from the report.
This information is presented in a bar chart and table.
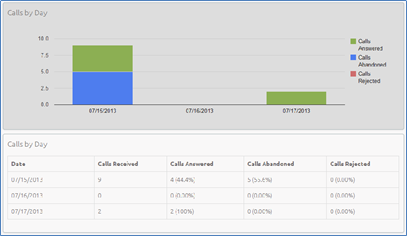
The bar chart displays the number of answered, abandoned and rejected calls for each day in the specified time period.
The table presents the following information for each day in the specified time period.
- Calls Received - The number of calls received.
- Calls Answered - The number of calls received that were answered by an Agent. This is also presented as a percentage of the total number of calls received.
- Calls Abandoned - The number of calls received that were abandoned by the caller before they were answered by an Agent. This is also presented as a percentage of the total number of calls received.
- Calls Rejected - The number of calls received that were rejected because there were no Agents available to take the call and the caller could not be put on hold. This could be because the maximum limit on the number of callers on hold had already been reached or because the relevant Queue does not support keeping callers on hold.
Calls by Queue
The Calls by Queue report allows you to see the number of calls that are being received through a particular Queue and how they are being handled. You may want to use this report to identify patterns in call volume so that you can anticipate busy periods in future, or you may use the output to identify unexpected rates of call abandonment or rejection. The report provides statistics on call activity for a particular Queue on each day that falls within your chosen time period. The entirety of this time period must be within the last year. Note that if you use the Start of day and End of day fields to specify the hours of a working day, any activity outside of these hours will be excluded from the report. This information is presented in a bar chart and table.
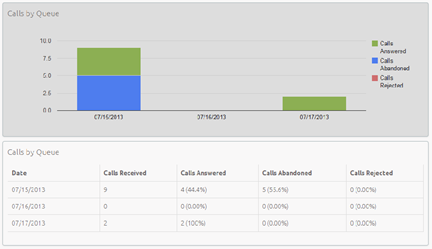
The bar chart displays the number of answered, abandoned and rejected calls for each day in the specified time period.
The table presents the following information for each day in the specified time period.
- Calls Received - The number of calls received through the Queue.
- Calls Answered - The number of calls received through the Queue that were answered by an Agent. This is also presented as a percentage of the total number of calls received through the Queue.
- Calls Abandoned - The number of calls received through the Queue that were abandoned by the caller before they were answered by an Agent. This is also presented as a percentage of the total number of calls received through the Queue.
- Calls Rejected - The number of calls received through the Queue that were rejected because there were no Agents available to take the call and the caller could not be put on hold. This could be because the maximum limit on the number of callers on hold had already been reached or because the relevant Queue does not support keeping callers on hold. This statistic is also presented as a percentage of the total number of calls received through the Queue.
Inbound Summary
The Inbound Summary report allows you to see a summary of the activity for each Pilot Number in your Queue(s). You may want to use this report to assess the success of marketing campaigns which use a Pilot Number as the first point of contact for your organization. The report provides statistics on the inbound calls received by all Pilot Numbers in all your queues within your chosen time period. The entirety of this time period must be within the last 60 days. This information is presented in a table only.
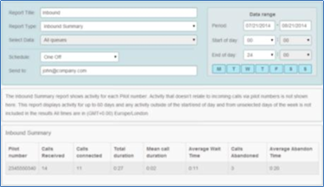
The table presents the following information for the specified time period.
- Pilot Number - The DN of each Pilot Number in your Queue(s).
- Calls Received - The number of calls received through the Pilot Number(s) in your Queue(s).
- Calls connected - The number of calls handled by the Pilot Number(s) in your Queue(s).
- Total duration - The total duration of all incoming calls received by the Pilot Number(s) in your Queue(s).
- Mean call duration - The average length of a call answered by the Pilot Number(s) in your Queue(s) during the time period specified.
- Average Wait Time - The average time a caller had to wait before the Pilot Number(s) handled the call.
- Calls Abandoned - The total number of calls received by the Pilot Number(s) in your Queue(s) that were abandoned by the caller before they were answered.
- Average Abandon Time - The average time callers waited in a Queue before hanging up without their call being answered by the Pilot Number.
Queue Summary
The Queue Summary report allows you to see the activity in all your Queues on a single report. This report includes both inbound calls and internal calls. You may want to use this report to identify patterns in call volume across your Queues so that you can anticipate busy periods in future, or you may use the output to identify unexpected rates of call abandonment or rejection. The report provides statistics on the activity of all your Queues within your chosen time period. The entirety of this time period must be within the last 60 days. This information is presented in a table only.

The table presents the following information for the specified time period.
- Queue - The name of the Queue.
- Calls Received - The number of calls received through this Queue. This is also presented as a percentage of the total number of calls received through the Queue.
- Calls Answered - The number of calls received through this Queue which were answered by an Agent. This is also presented as a percentage of the total number of calls received through the Queue.
- Calls Abandoned - The number of calls received through this Queue that were abandoned by the caller before they were answered by an Agent. This is also presented as a percentage of the total number of calls received through the Queue.
- Calls Rejected - The number of calls received through this Queue that were rejected because there were no Agents available to take the call and the caller could not be put on hold. This could be because the maximum limit on the number of callers on hold had already been reached or because the relevant Queue does not support keeping callers on hold. This statistic is also presented as a percentage of the total number of calls received through the Queue.
- Mean waiting time - The average time callers had to wait before the call was answered by this Queue.
- Mean call duration - The average length of a call answered by this Queue during the time period specified.
- Mean abandon time - The average time callers waited in a Queue before hanging up without their call being answered.
Abandoned Calls Summary
The Abandoned Calls Summary report allows you to see how many calls are abandoned across all of your Queues. This report includes both inbound calls and internal calls. You may want to use this report to identify unexpected rates of call abandonment in particular Queues which might indicate that you need more Agents in that Queue. The report provides statistics on the call abandonment rate for all your Queues within your chosen time period. The entirety of this time period must be within the last year. This information is presented in a table only.
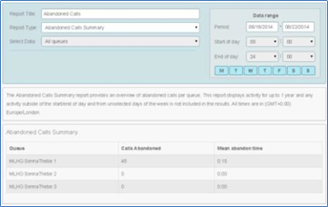
The table presents the following information for the specified time period.
- Queue - The name of the Queue.
- Mean abandon time - The average time callers waited in a Queue before hanging up without their call being answered.
- Calls Abandoned - The number of calls received through this Queue that were abandoned by the caller before they were answered.
Short Calls by Agent
The Short Calls by Agent report allows you to see the number of calls of less than 5 seconds handled by your Agents. You may want to use this report to identify Agents with an abnormally high number of short calls which might suggest that they are not handling callers correctly. The report provides statistics for the number of short calls handled by all your Agents within your chosen time period. The entirety of this time period must be within the last 60 days. This information is presented in a table only.
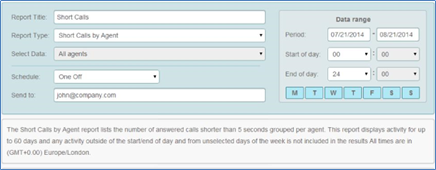
The table presents the following information for all your Agents over the specified time period.
- Agent - The name of the Agent.
- Short calls - The number of calls lasting less than 5 seconds handled by the Agent.
Frequent Callers Summary
The Frequent Callers Summary report allows you to see the 50 most active callers, in order, for the selected Queue. You may want to use this report to identify callers whose repeat calls might indicate their call was not dealt with satisfactorily, for example because they called multiple times but hung up before their call was answered each time, or who are particularly good customers who might be suitable targets for a marketing campaign. The report provides statistics for the 50 most active callers to a selected Queue within your chosen time period. The entirety of this time period must be within the last 60 days. The information is presented in a table only.
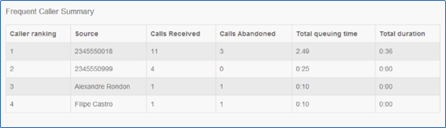
The table presents the following information for the selected Queue for the specified time period.
- Caller ranking - The ranking for this caller, based on the number of calls received from them during the specified time period.
- Source - The number of the calling party.
- Calls Received - The number of calls received from this caller.
- Calls Abandoned - The number of calls that were abandoned by this caller before they were answered by an Agent.
- Total queuing time - The total amount of time this caller had to wait before their call was answered by an Agent.
- Total duration - The total duration of all incoming calls received from this caller.