Solarwinds - Basics
Overview
This article will go over the basics of Solarwinds. How to navigate the dashboard and a node/circuit.
Solarwinds Dashboard
The areas that will be used most on the dashboard are the "Search for Nodes", "Down Nodes", and the "Down Interfaces" specifically for the car routers.
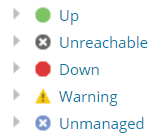
Here are the Node Status codes:
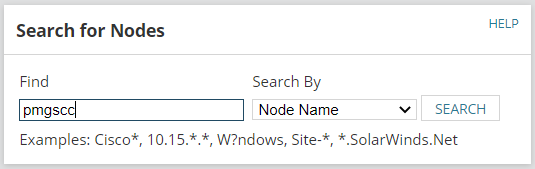
Search for Nodes
This section of the dashboard is where you search for a specific node or you can search the company name to find all nodes for a certain customer. The node name most of the time will be in the alert if the circuit has dropped and been down for 15 minutes. If you are trying to find a node without having an alert then you can look up the case history to find an existing case where that node had dropped and find the name that way.
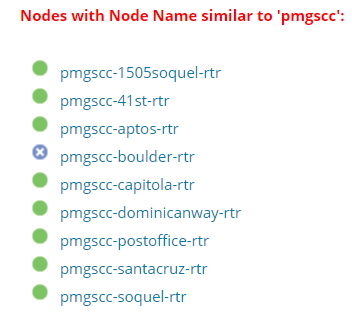
Once you search your results will pull up with all the nodes matching that search.
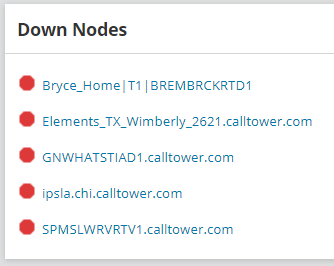
Down Nodes
The down nodes section is a list of all nodes that are actively down. There should most likely be a ticket open for these down nodes where Support is working with the customer and if needed the carrier to get the node back up.
***If the Node is down then you will not be able to telnet to the router as the circuit is down.
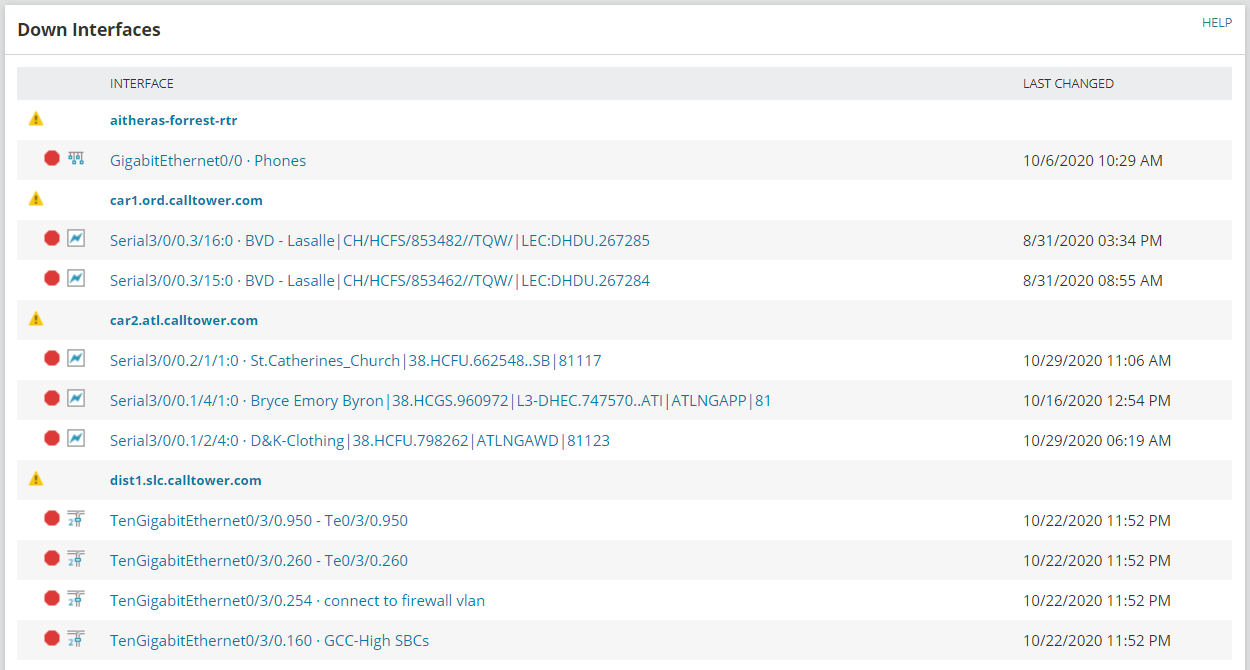
Down Interfaces
This section shows the interfaces that are down. A lot of these interfaces are T1's that will require BERT tests. Here is the article to run those BERT tests: Troubleshooting: Customer T1 (Appia)
You can click into each interface to review more details and information about that connection.
Node Details
When you click into a node there are several details listed. The details mostly used are "Management", "Node Details", and "Current Percent Utilization of Each Interface."
Management
Below are the options you will use most.
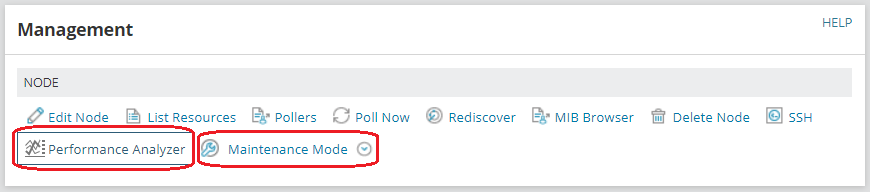
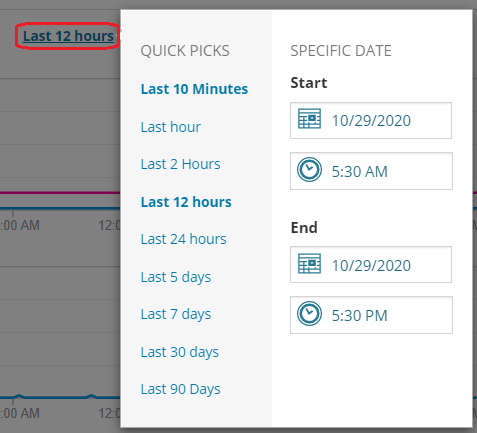
- Performance Analyzer - This will provide details for the CPU load, Memory Usage, Response Times, Alerts, Events, and Status. You can edit the time frame of the data that this can pull. You can choose the quick picks or specify a date and time down to the minute.
- Maintenance Mode - In Maintenance mode you can Unmanage the node, Mute the Alerts, and Schedule.
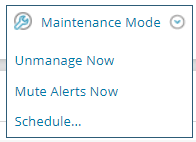
-
- Unmanage Now - You can unmade the node. This will not generate any alerts. This is used if we know there is going to be maintenance or some other reason that the node will be going down.
- Mute Alerts Now - This will shut down all of the alerts this node can generate. Some example alerts are "Node is down", "Node Rebooted", and "Log Analyser Agent Overloaded"
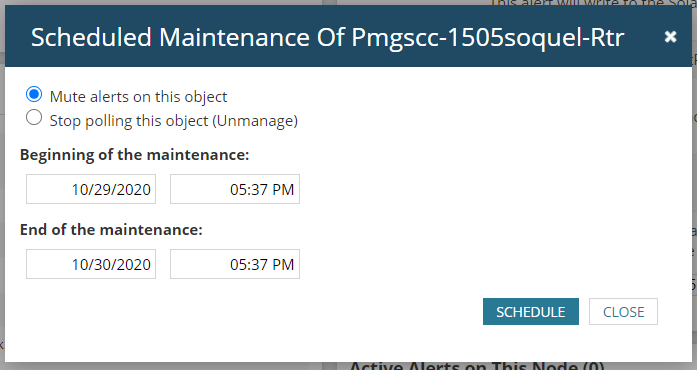
- Schedule - You can schedule the node to be unmanaged for a specified time frame.
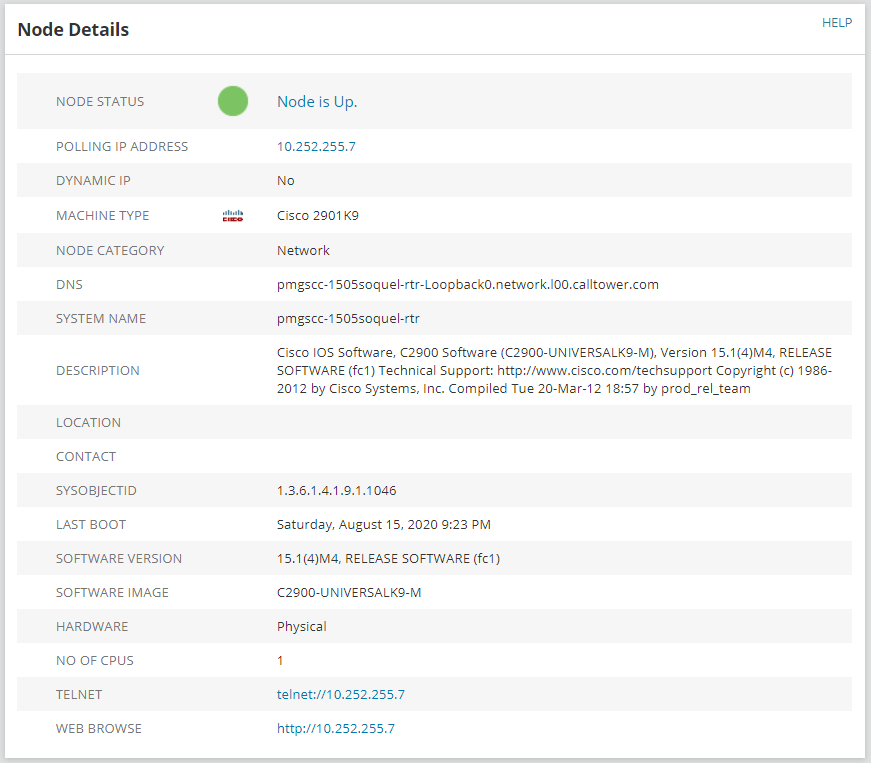
Node Details
This provides all of the details of the node. The detail you will use the most is the POLLING IP ADDRESS. The polling ip address is the ip address you will use to telnet into the router.
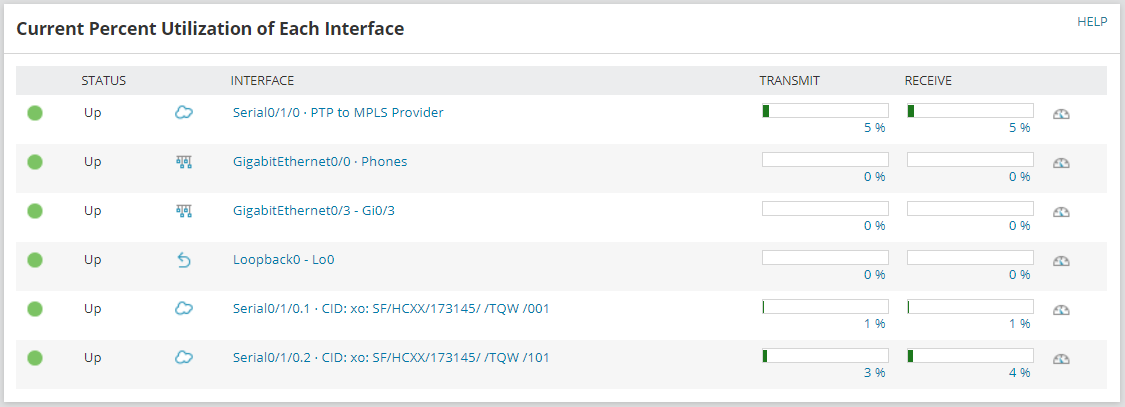
Current Percent Utilization of Each Interface
This section will list the utilization of each interface. You can click and go into each interface and get more details on each interface and its utilization.
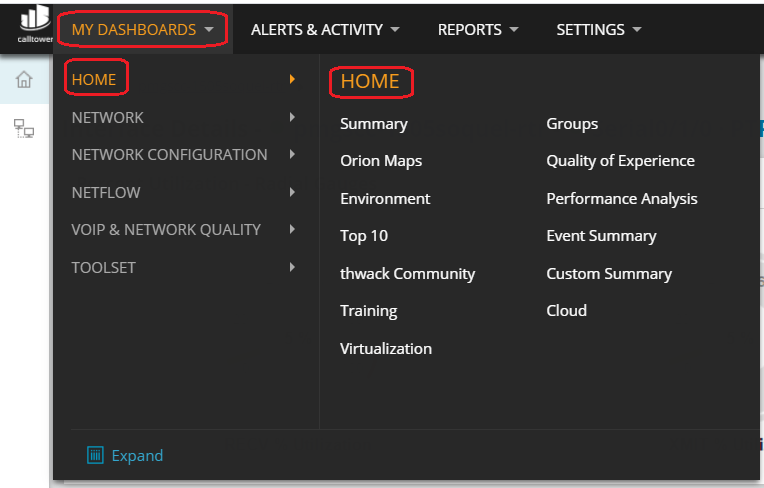
Getting back to the Dashboard
You will go to the dropdown menu for "MY DASHBOARDS" at the top of the page. You then will go to HOME and HOME.